KS Box Breakout Signal
by MQL5
- Version 1.15
- Works on MT5
- Free Trial — no cost to download
- Direct download link, no installer bundling
Product description
KS Box Breakout Signal is a custom MQL5 indicator for MetaTrader 5 that automatically detects consolidation boxes (price ranges) and signals breakouts with visual elements and volume analysis.
Core Concept
The indicator identifies periods where price volatility compresses (based on a normalized volatility calculation), forms a box between the high and low of that consolidation, and then waits for a decisive breakout above the top or below the bottom of the box.
It combines:
Volatility-based box detection
Volume confirmation / sentiment
Clear visual boxes with color zones
Breakout signals (arrows + large "BUY"/"SELL" labels)
Key Features
Feature Description
Automatic Box Detection Detects consolidation zones using normalized volatility over Box Detection Length (default 14). Creates boxes from recent highs/lows during low-volatility periods.
Nested Channels Option inp_overlap = false by default — prevents overlapping boxes for cleaner charts. Can be enabled for more boxes.
Strong Closes Only Option (inp_strong = true) to require a strong close (midpoint of candle) for breakout confirmation to reduce false signals.
Volume Analysis Displays volume information inside each box. Three modes: Volume, Comparison (bullish vs bearish volume), or Delta. Shows text like "12.5K" or "8.3K/4.2K".
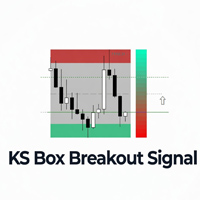
Color-Zoned Boxes Each box is divided into three parts: • Upper zone (red) — resistance area • Middle zone (silver/grey) — neutral • Lower zone (green) — support area
Center Line Dashed grey line in the middle of the box.
Breakout Signals - Bullish breakout: Large "BUY" label + arrow - Bearish breakout: Large "SELL" label + arrow When price breaks the box, the box is extended to the breakout bar and then removed.
Volume Gauge Bar On the current (latest) box, it draws a vertical gradient bar (red → green/teal) showing volume sentiment/pressure. A white pointer (arrow) moves up/down the gauge indicating whether buying or selling volume is dominant.
History Depth Scans back inp_histDays (default 5 days) to find boxes.
Normalization Length Controls how far back it looks to normalize volatility (default 100 bars).
Visual Elements (matching your logo image)
Red top zone + Green bottom zone inside the box
Candlestick chart in the middle
Vertical gradient gauge on the right (red at bottom → teal/green at top)
Upward arrow on the gauge
Horizontal dashed/solid lines
Volume text labels inside boxes
Big colored BUY / SELL text when breakout occurs
Inputs Summary
Main Settings: Overlap, Strong Closes, Normalization Length, Box Detection Length
Volume Analysis: Display mode and scale
History: How many days to scan
Appearance: Custom green and red colors
Best Use Cases
Breakout trading strategy (trade in the direction of the breakout)
Filtering fakeouts using volume confirmation inside the box
Visual market structure (consolidation → expansion)
Scalping, day trading, or swing trading on any timeframe
This indicator is quite advanced for a box-breakout tool because it adds volume pressure analysis and a live gauge, which most simple box indicators lack.