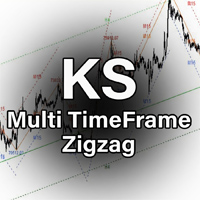
KS Multi TimeFrame Zigzag
by MQL5
- Version 2.1
- Works on MT5
- Free Trial — no cost to download
- Direct download link, no installer bundling
Product description
KS Multi TimeFrame Zigzag
This is a Multi-Timeframe ZigZag Channel Indicator. It plots ZigZag pivots from up to 4 different timeframes simultaneously on your current chart, and for each ZigZag, it automatically draws channels (Upper, Middle, Lower lines) based on the deviation of price from the ZigZag legs.
It combines the power of:
Classic ZigZag (to find swing highs/lows)
Price Channels around those swings
Multi-Timeframe analysis
Core Functionality
1. Multi-Timeframe ZigZag
You can enable up to 4 independent ZigZags, each running on its own timeframe.
Default setup:
ZZ1 → M15
ZZ2 → H1
ZZ3 → H4
ZZ4 → D1
2. ZigZag + Channel System
For every ZigZag swing (high or low), the indicator:
Detects pivot highs and pivot lows
Draws a Middle Line connecting the pivots
Calculates the maximum deviation (how far price moved away from the ZigZag leg)
Draws Upper Channel and Lower Channel based on that deviation
This creates a dynamic price envelope/channel around each ZigZag.
3. Visual Features
Colored Arrows on chart for pivots (DodgerBlue, Magenta, Lime, Gold)
Trend Lines for Mid, Upper, and Lower channels
Price Labels at pivots (optional)
Timeframe Labels on lines (e.g., "M15", "H4") — very useful for quick identification
Ray Extension of the latest (unfinished) channel to the right
Key Input Parameters (for each ZigZag)
Parameter Purpose
Enable Turn this ZigZag on/off
Timeframe Which TF to calculate on
Length Sensitivity (higher = fewer, stronger swings)
Extend Last Extend the current unfinished channel to the right
Show Channel Show Upper & Lower deviation lines
Show Labels Show price at pivots
Show TF Label Show "M15", "H4" etc. on lines
Mid / Upper / Lower Color, Style, Width Customization of each line
How It Works (Simplified)
The indicator pulls data from the selected timeframe.
It runs a ZigZag algorithm (similar to the built-in one but customized).
For every confirmed swing:
It measures how far price deviated from the straight ZigZag line.
Creates parallel channels (Upper & Lower) using that maximum deviation.
The Middle Line is the actual ZigZag.
Everything is drawn using objects (trend lines + text).
Best Use Cases
Multi-timeframe confluence — see higher timeframe structure on lower timeframe chart
Dynamic Support/Resistance — the channels act as dynamic zones
Breakout Trading — when price breaks upper/lower channel
Trend Identification — alignment of multiple TFs
Swing Trading — clear visual of swing points across timeframes
Advantages
Very clean and organized (color-coded per timeframe)
Good performance (uses throttling to avoid lag)
Highly customizable
Shows real multi-timeframe structure clearly