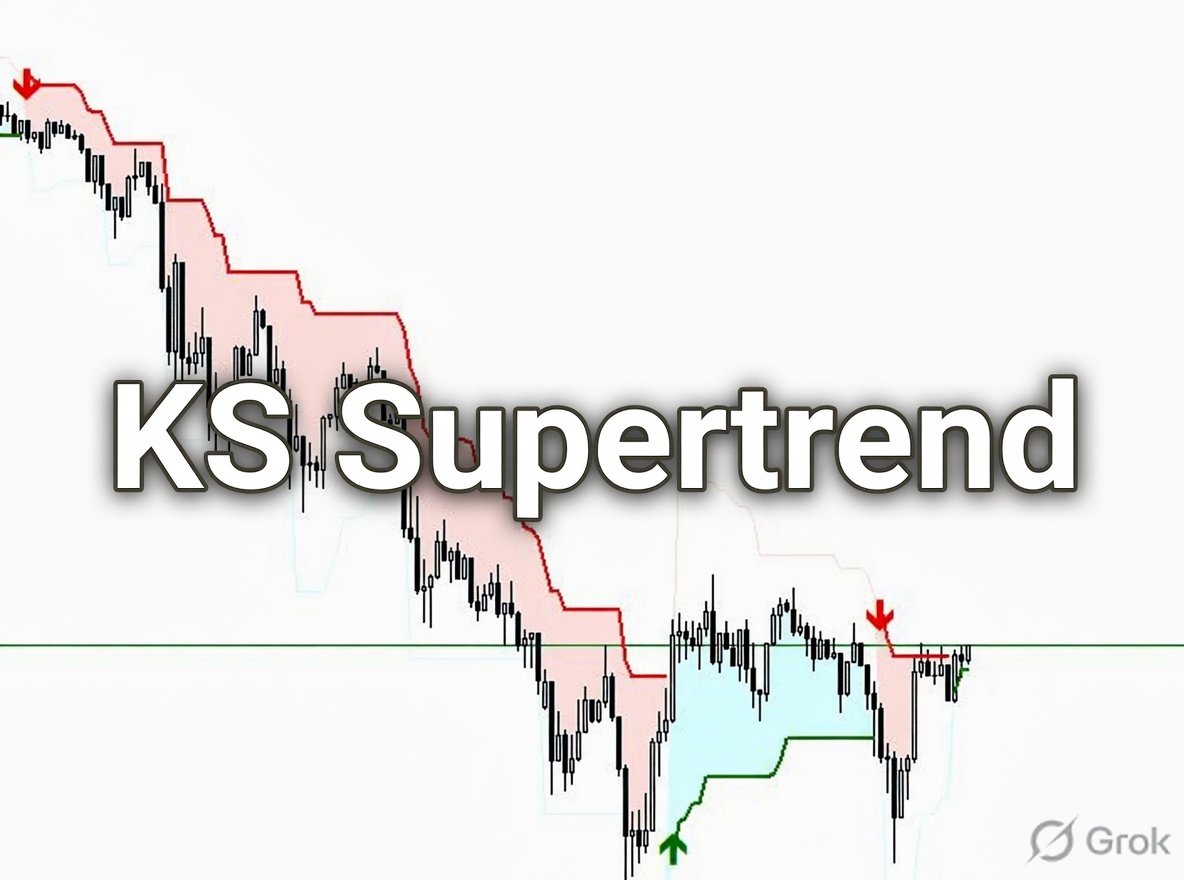
KS SuperTrend Indicator
by MQL5
- Version 1.9
- Works on MT5
- Free Trial — no cost to download
- Direct download link, no installer bundling
Product description
KS Supertrend Indicator
Core Features
Classic Supertrend Algorithm with accurate Pine Script-style logic
Uses ATR (Average True Range) to dynamically plot trend-following bands
Dual Trend Visualization:
Green line = Uptrend (Bullish)
Red line = Downtrend (Bearish)
Smart Background Highlighting:
Light green background fill during uptrends
Light red background fill during downtrends
Can be toggled on/off
Clear Buy & Sell Signals:
Green ▲ arrow for Buy signals (trend flip from down to up)
Red ▼ arrow for Sell signals (trend flip from up to down)
Arrows are intelligently positioned just outside the trend line for better visibility
Key Settings & Customization
ATR Period (default: 10)
ATR Multiplier (default: 3.0)
Display Settings:
Show/Hide Buy & Sell signal arrows
Enable/Disable background highlighting
Alert System:
Desktop popup alerts
Push Notifications to mobile phone (MT5 app)
Alerts only trigger on closed bars (no repainting on current bar)
Each alert fires only once per bar (prevents spam)
Separate toggles for Buy alerts and Sell alerts
Technical Advantages
Optimized incremental calculation for better performance (even on long histories)
Proper handling of initial ATR warmup period
Clean, market-ready code structure
Uses value correctly for clean chart appearance
Includes safety check for push notification settings
How It Works
indicator helps you identify the current trend direction and potential reversal points:
When the price is above the Supertrend line → Uptrend (green)
When the price is below the Supertrend line → Downtrend (red)
Buy Signal: The Supertrend line flips from red to green Sell Signal: The Supertrend line flips from green to red
This makes it for trend following, stop-loss placement, or as a filter in trading strategies.
Use Cases
Trend trading on any timeframe (M5 to Daily)
Trailing stop-loss tool (place stop below/above the Supertrend line)
Early trend reversal detection
Combining with other indicators (RSI, Moving Averages, Support/Resistance)